By the ClimateForce
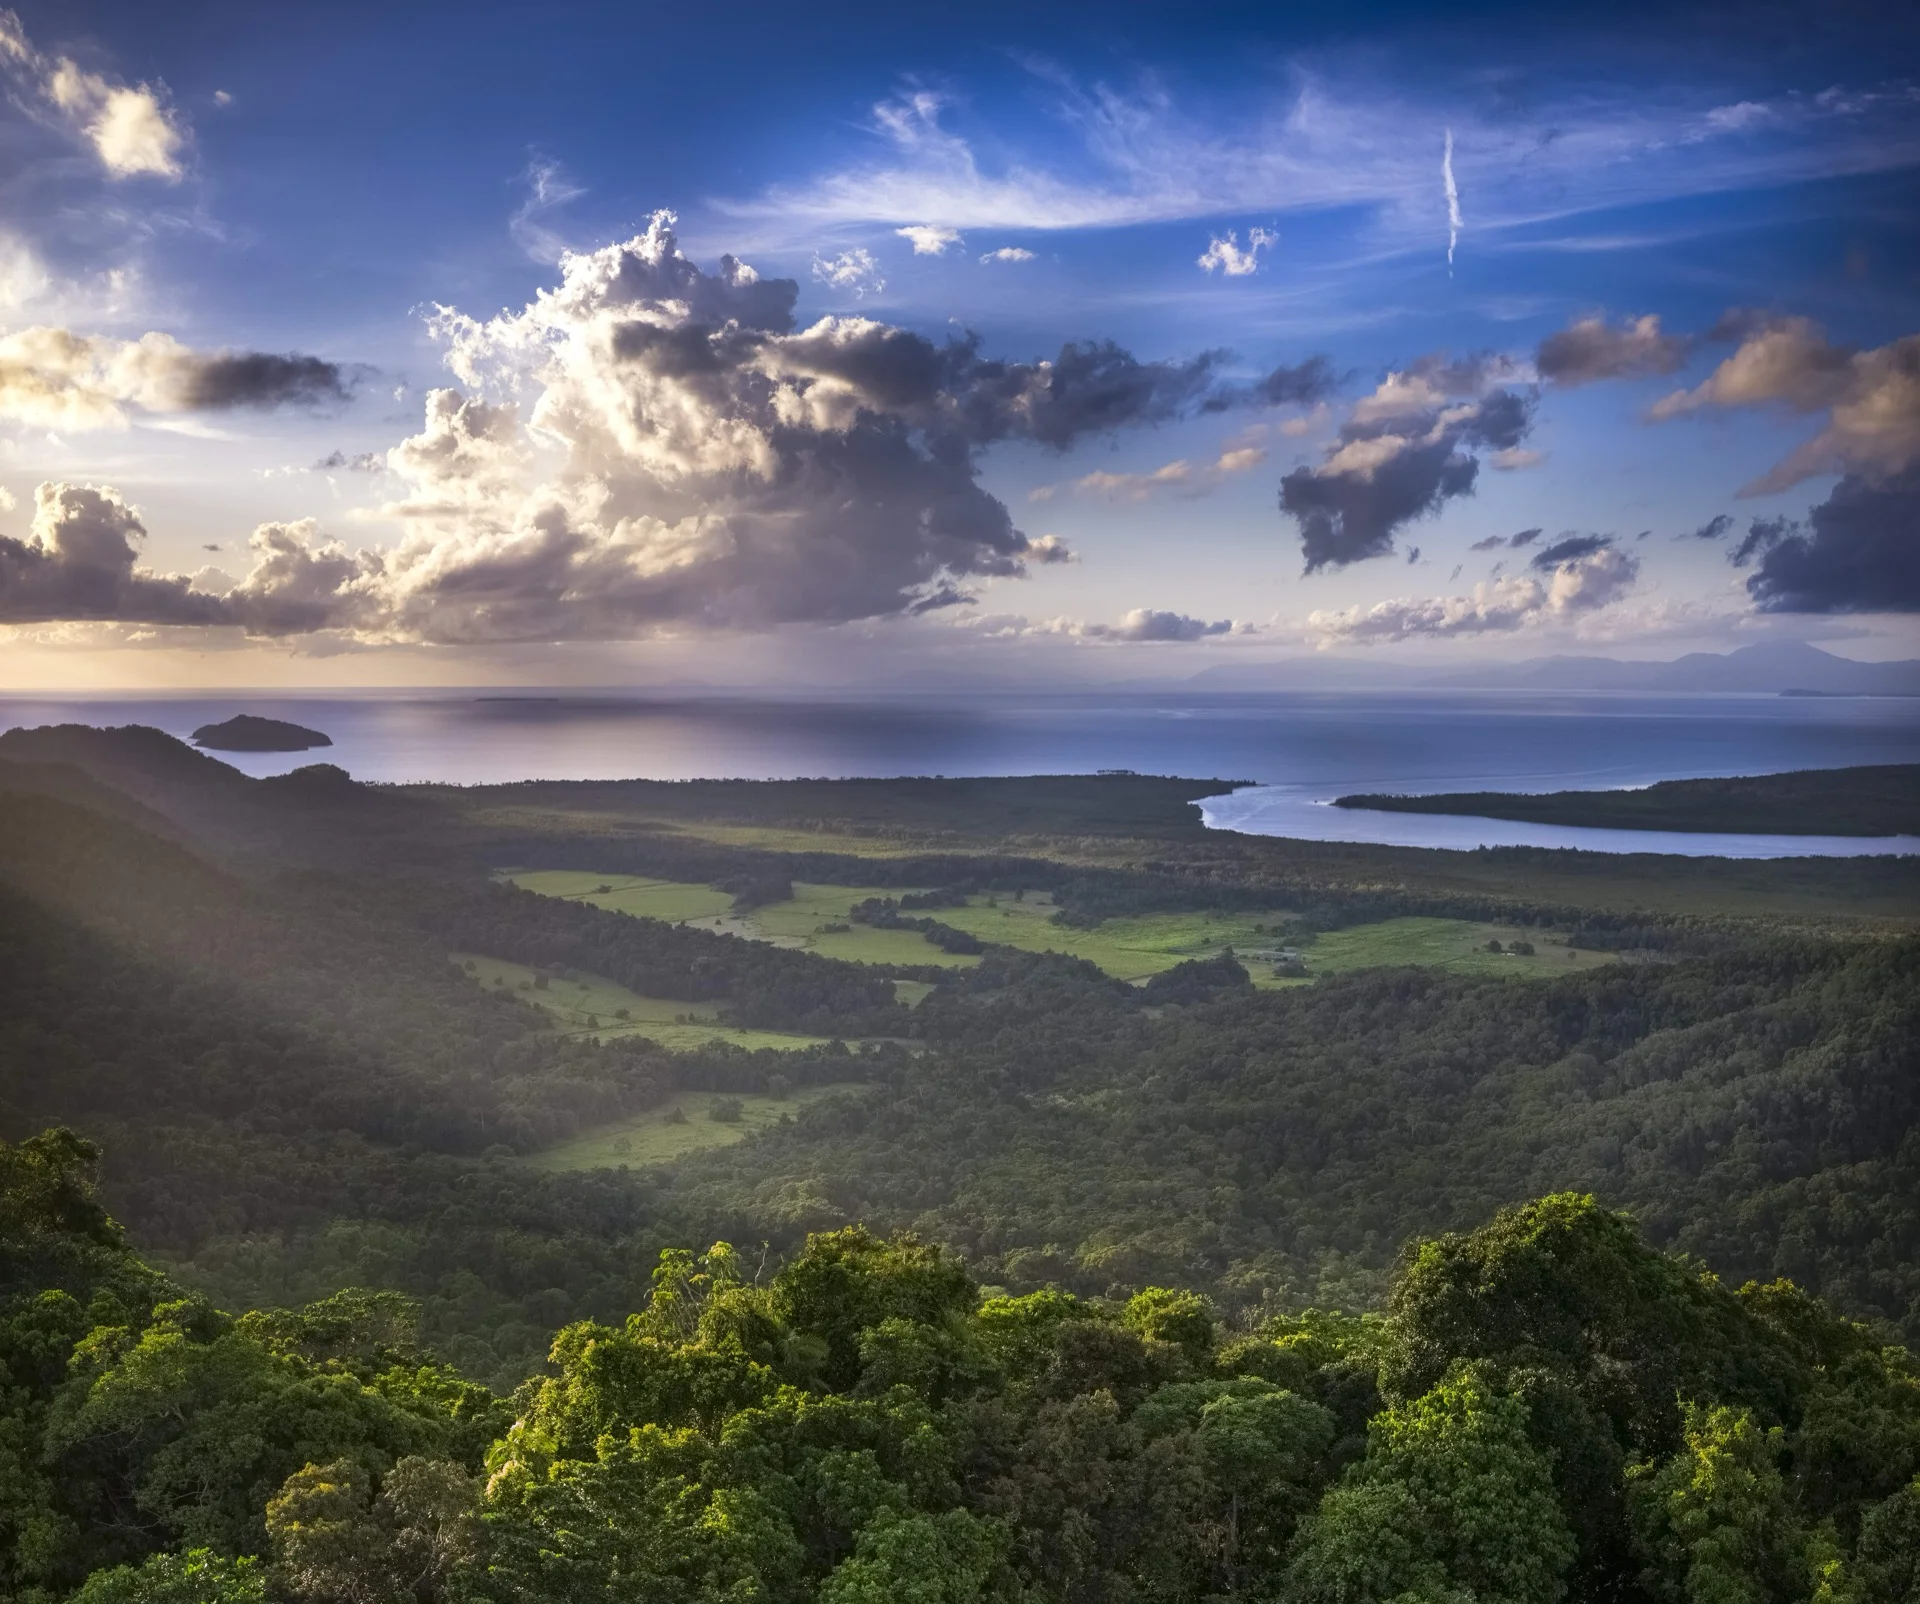
Read your land.
See what it holds.
Everything happens on land — a tree planted, a paddock returning, a school built, a community served. Land-IP reads it back with the science visible underneath. Every region's work lives in the same ground; what each one learns becomes available to all. Free to use. Built on the ground.
Across the portfolio
Every property, read together.
What this opens up
The more land is read, the more becomes possible.
A paddock informs the watershed that holds it. A property informs the district it sits in. A partnership informs the region it serves. Land-IP makes the layers visible to each other.
A farmer can see how their land fits. A council can see what crosses its border. A funder can see what activates across a portfolio. A community can see what’s tended on the ground.
The system grows by being used — and the more it holds, the more it answers.
Three ways in
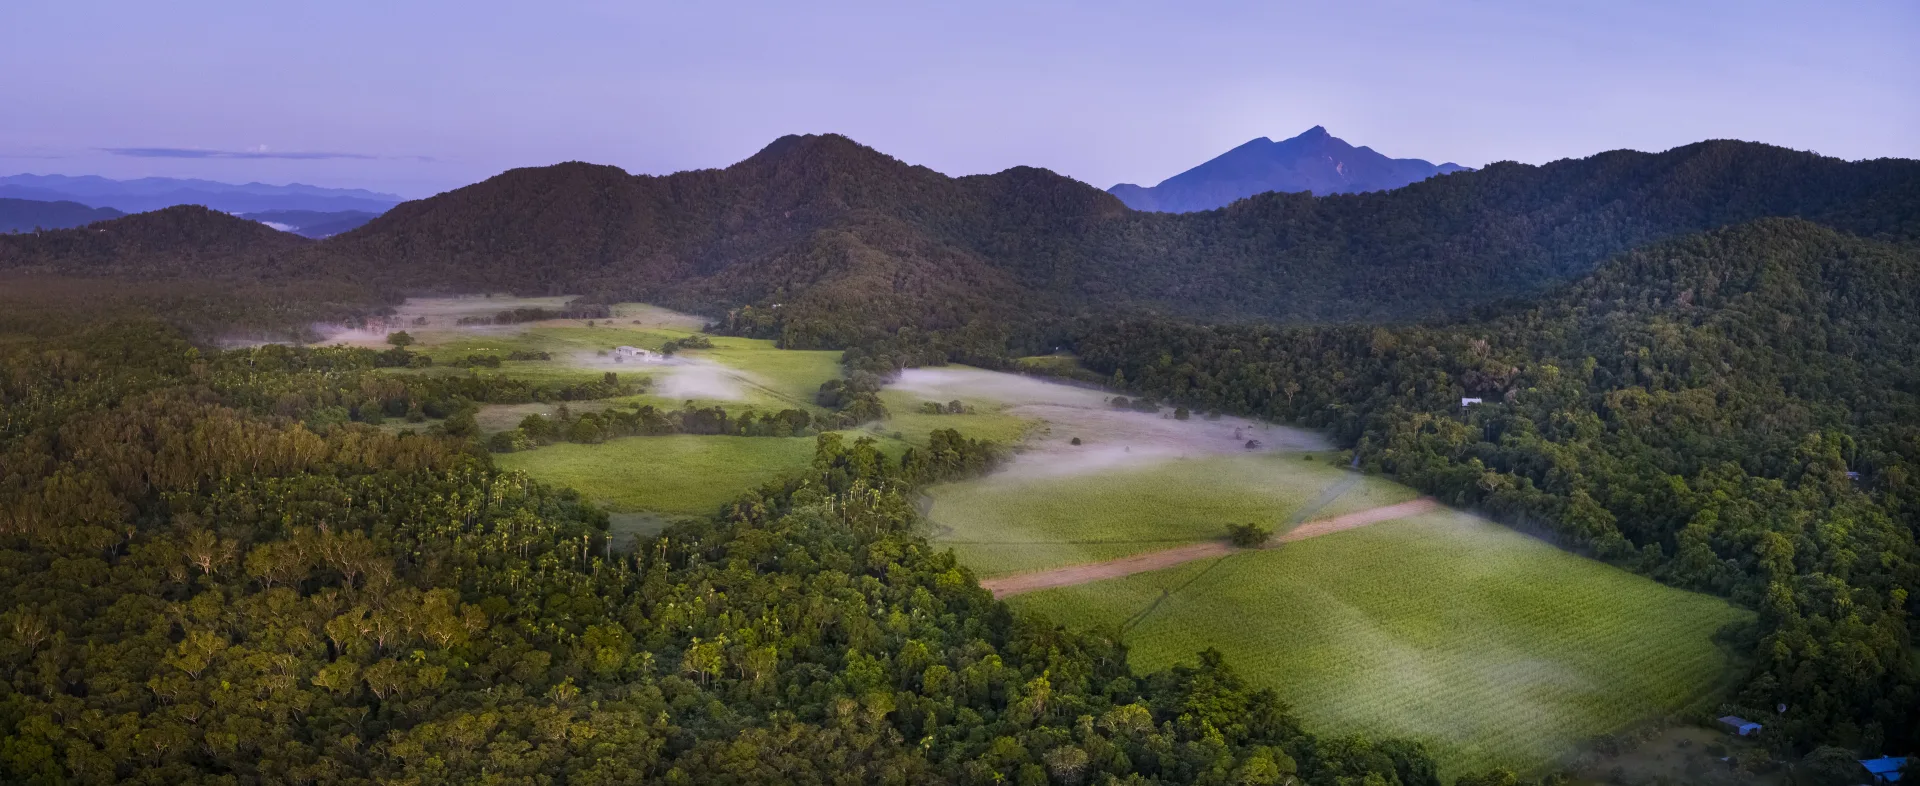
Find the land that reads like yours.
A property, country in care, or a district moving together. Three worked examples from Far North Queensland — same data, same engine, three reads of it.
How we measure
What your land could produce — measured in what it actually grows.
Kilos. Cubic metres. Head per hectare.
Yields are how we describe what land grows. Kilograms of fine-flavour cacao, cubic metres of timber, head of cattle per hectare. The figures stay honest because they’re tied to what the land does, not to what a market is doing this week.
An honest range, on every figure.
Every number on every page carries an explicit low–base–high band, typically around ±50%. That’s the real range that real seasons, real soils, and real management produce. A figure without a range is a figure you can’t trust.
We trial it on our own land first.
Land-IP is research and development by The ClimateForce. We trial every system on our own property at Cape Kimberley before we ever project it onto someone else’s. Every figure traces back to peer-reviewed science with a citation that opens.
We don’t tell you what your land is worth. We give you a citation-backed picture of what it can produce — range-honest, openly auditable — and let you take it from there.
How the system reads your land
What activates underneath every reading.
Land-IP doesn’t make things up. Every reading traces back through a calculator grounded in published methodology, against a polygon of your land, against source documents we can name. Three layers, one chain you can follow.
Source-cited
Every recommendation traces back to a peer-reviewed or government-grade source document. We name the source. You can read it.
Calculator-driven
Land-IP runs validated calculators against your land — slope, waterways, yields, allocations. Each calculator’s logic is grounded in published methodology.
System-activated
When Land-IP is on against a property, it doesn’t just analyse. It makes the systems, supply chains, and partners on that land legible and reachable.
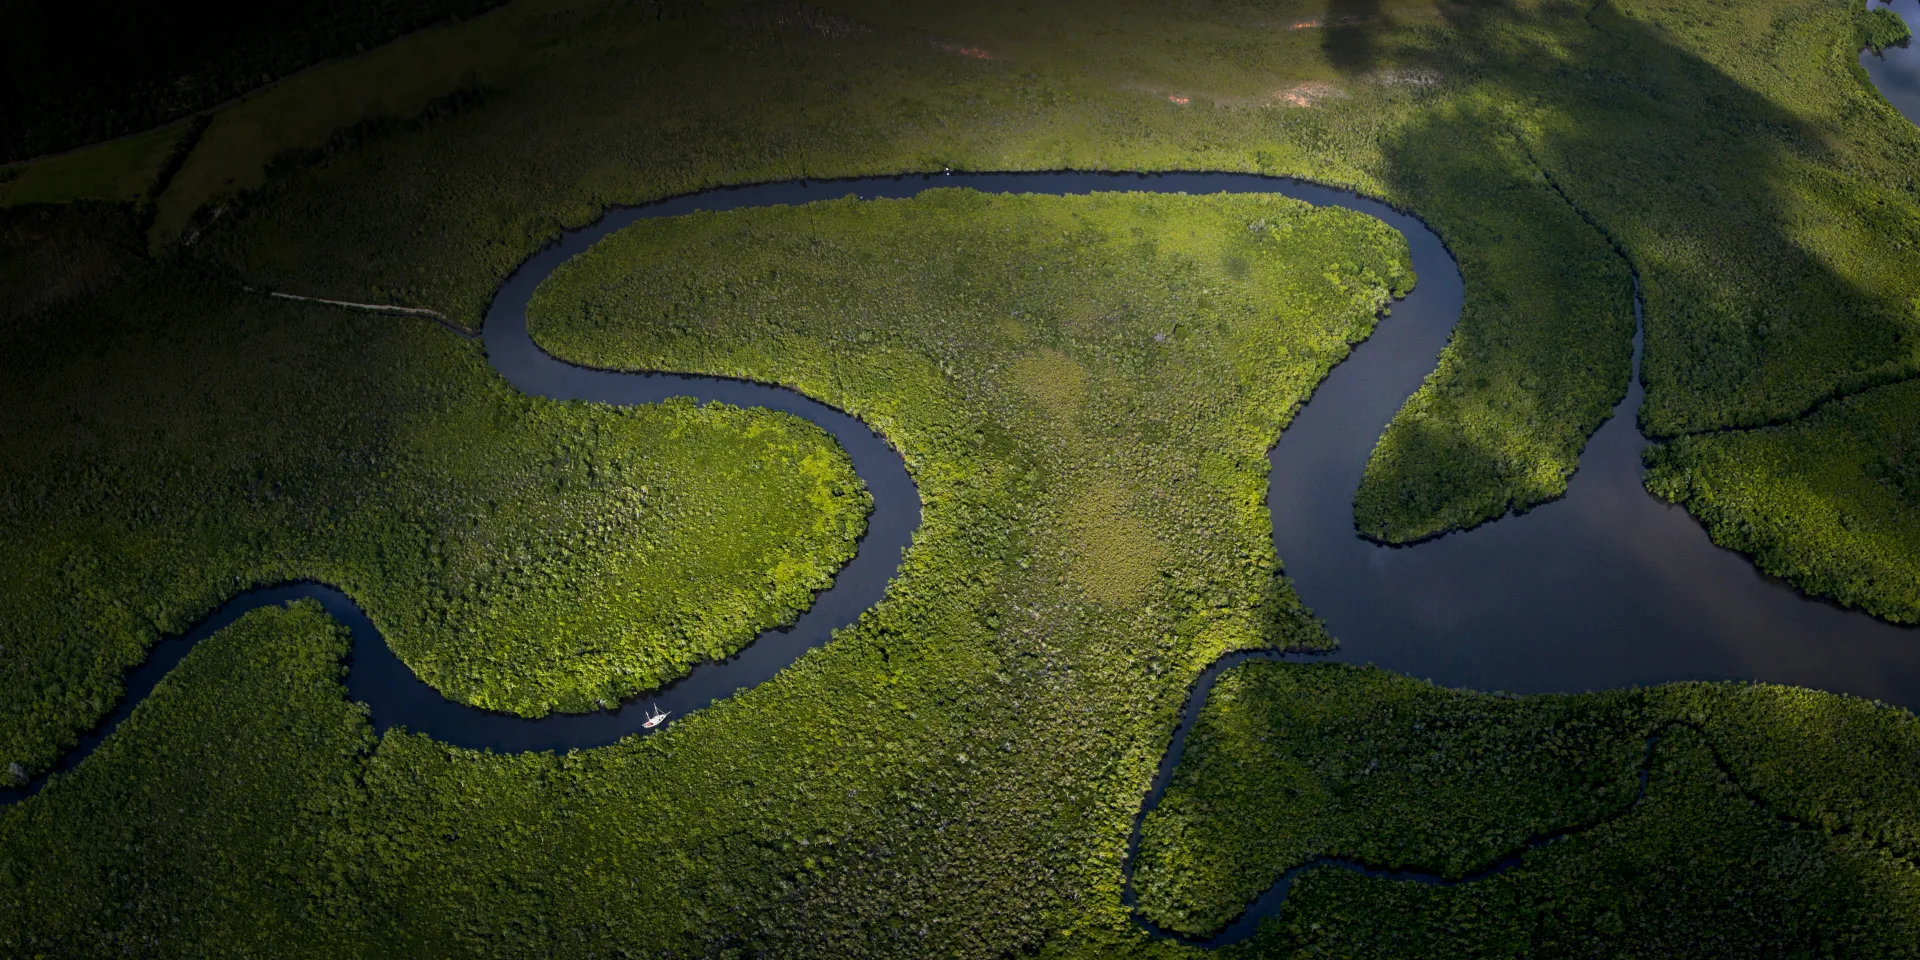
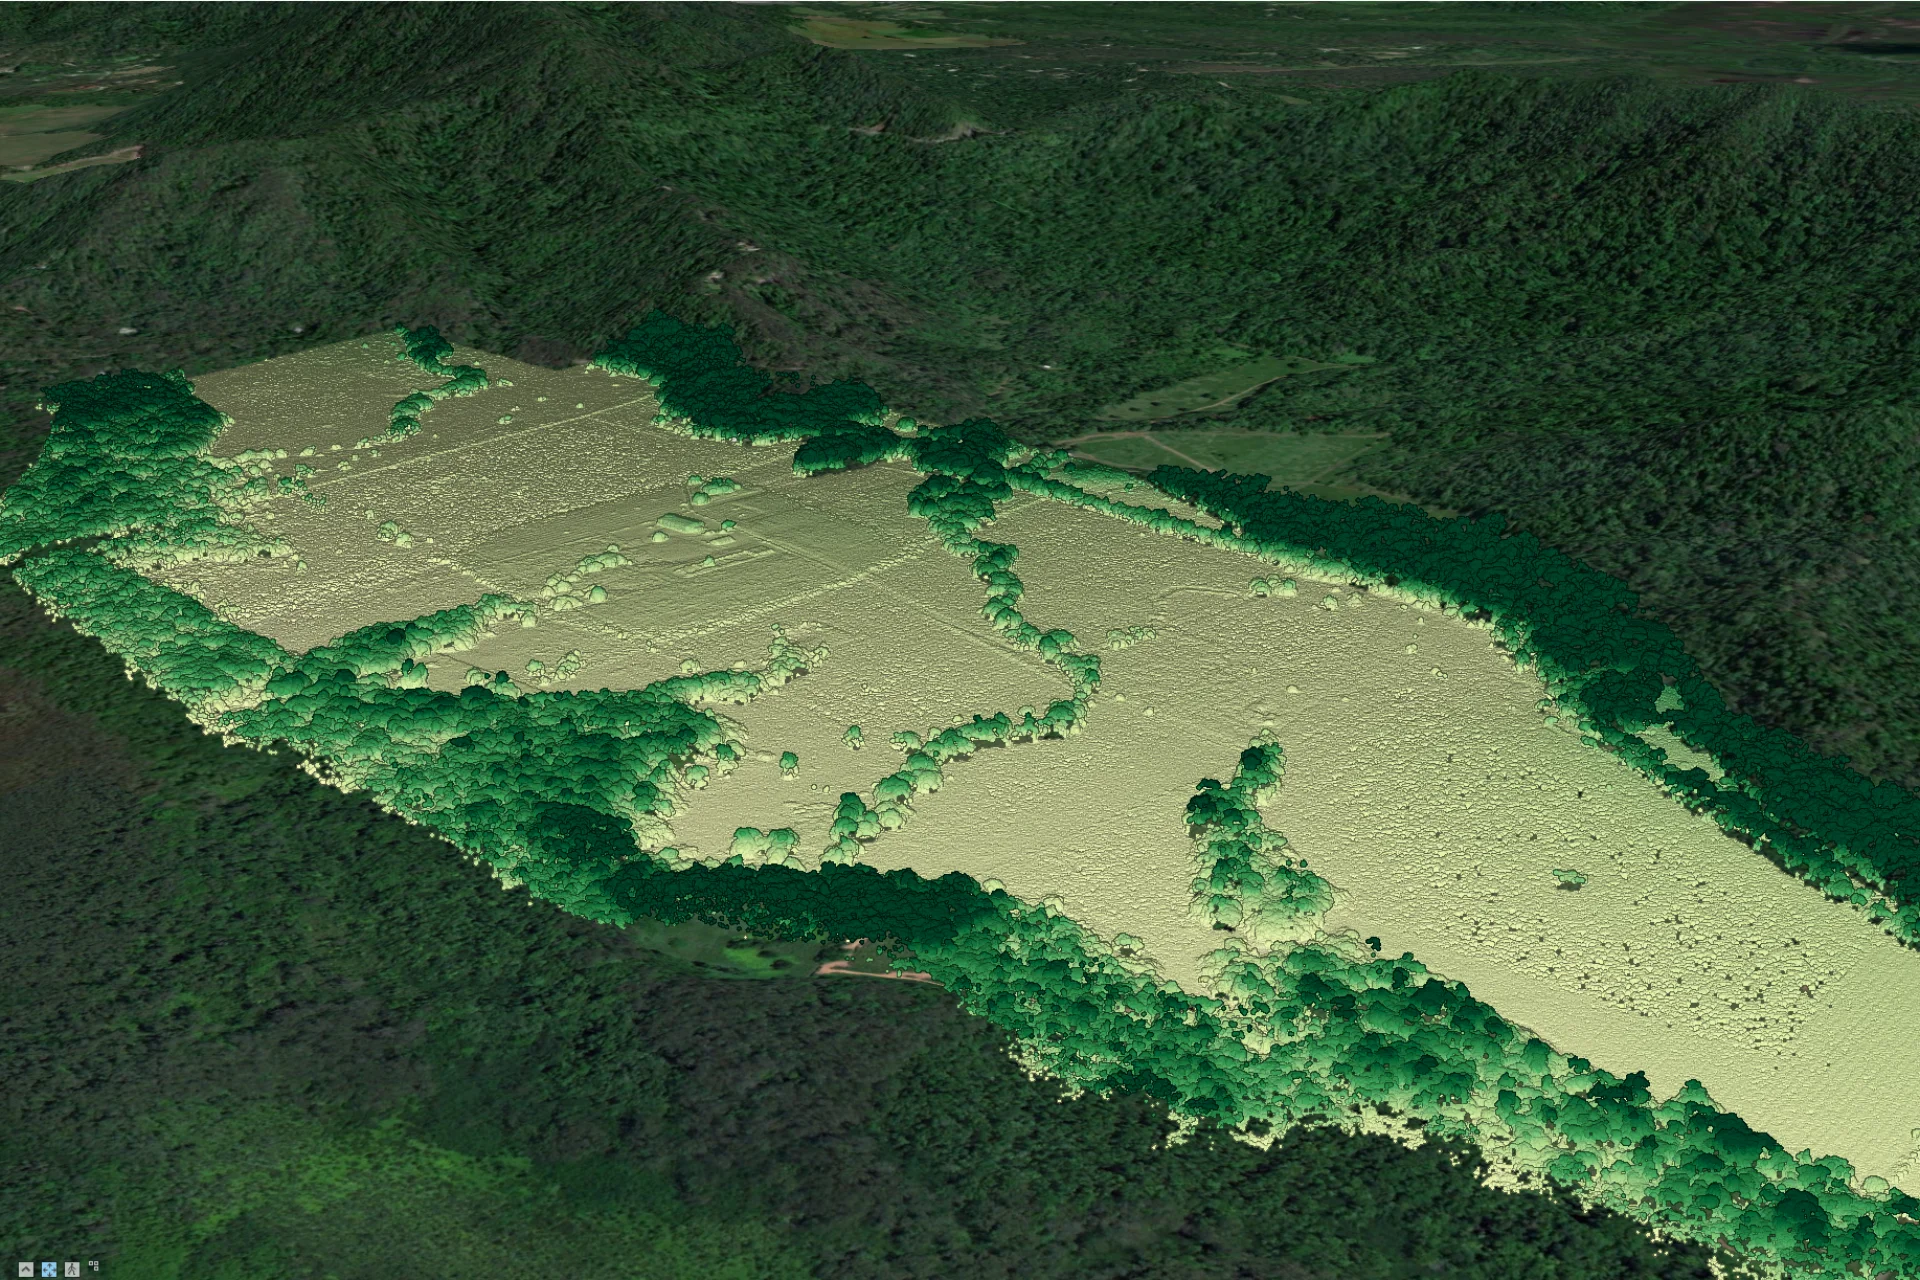
One worked example · slope-constrained land
A constraint, traced — end to end.
- NASA SRTM 1-arc-second DEM — global elevation grid at 30 m resolution, served via Google Earth Engine
- Queensland Watercourse Identification Map (WIM) — line geometries of regulated watercourses across the state
- Queensland statutory definition of constrained land — slope ≥ 14° OR within 20 m of a regulated watercourse
ee.Terrain.slope on SRTM, builds three masks (gentle < 7° / moderate 7–14° / steep ≥ 14°), reduces to hectares per class, and unions the steep mask with the 20 m WIM-line buffer to get the constrained area.Cape Kim runs four plant-outs today — three native systems plus one productive mixed (agroforestry). The slope read above is one of the layers we use to keep asking what each paddock wants next, and the partner properties joining beside us run the same read on their own.
Same datasets, same constants, same calculator. Try it on any polygon you can draw.
Run this on your own landLand-IP is free to use. We earn through the market activations that flow through the system — when a paddock activates a supply chain, when a property activates a partner, when a region activates its scale. The more land that activates, the more reach we share.
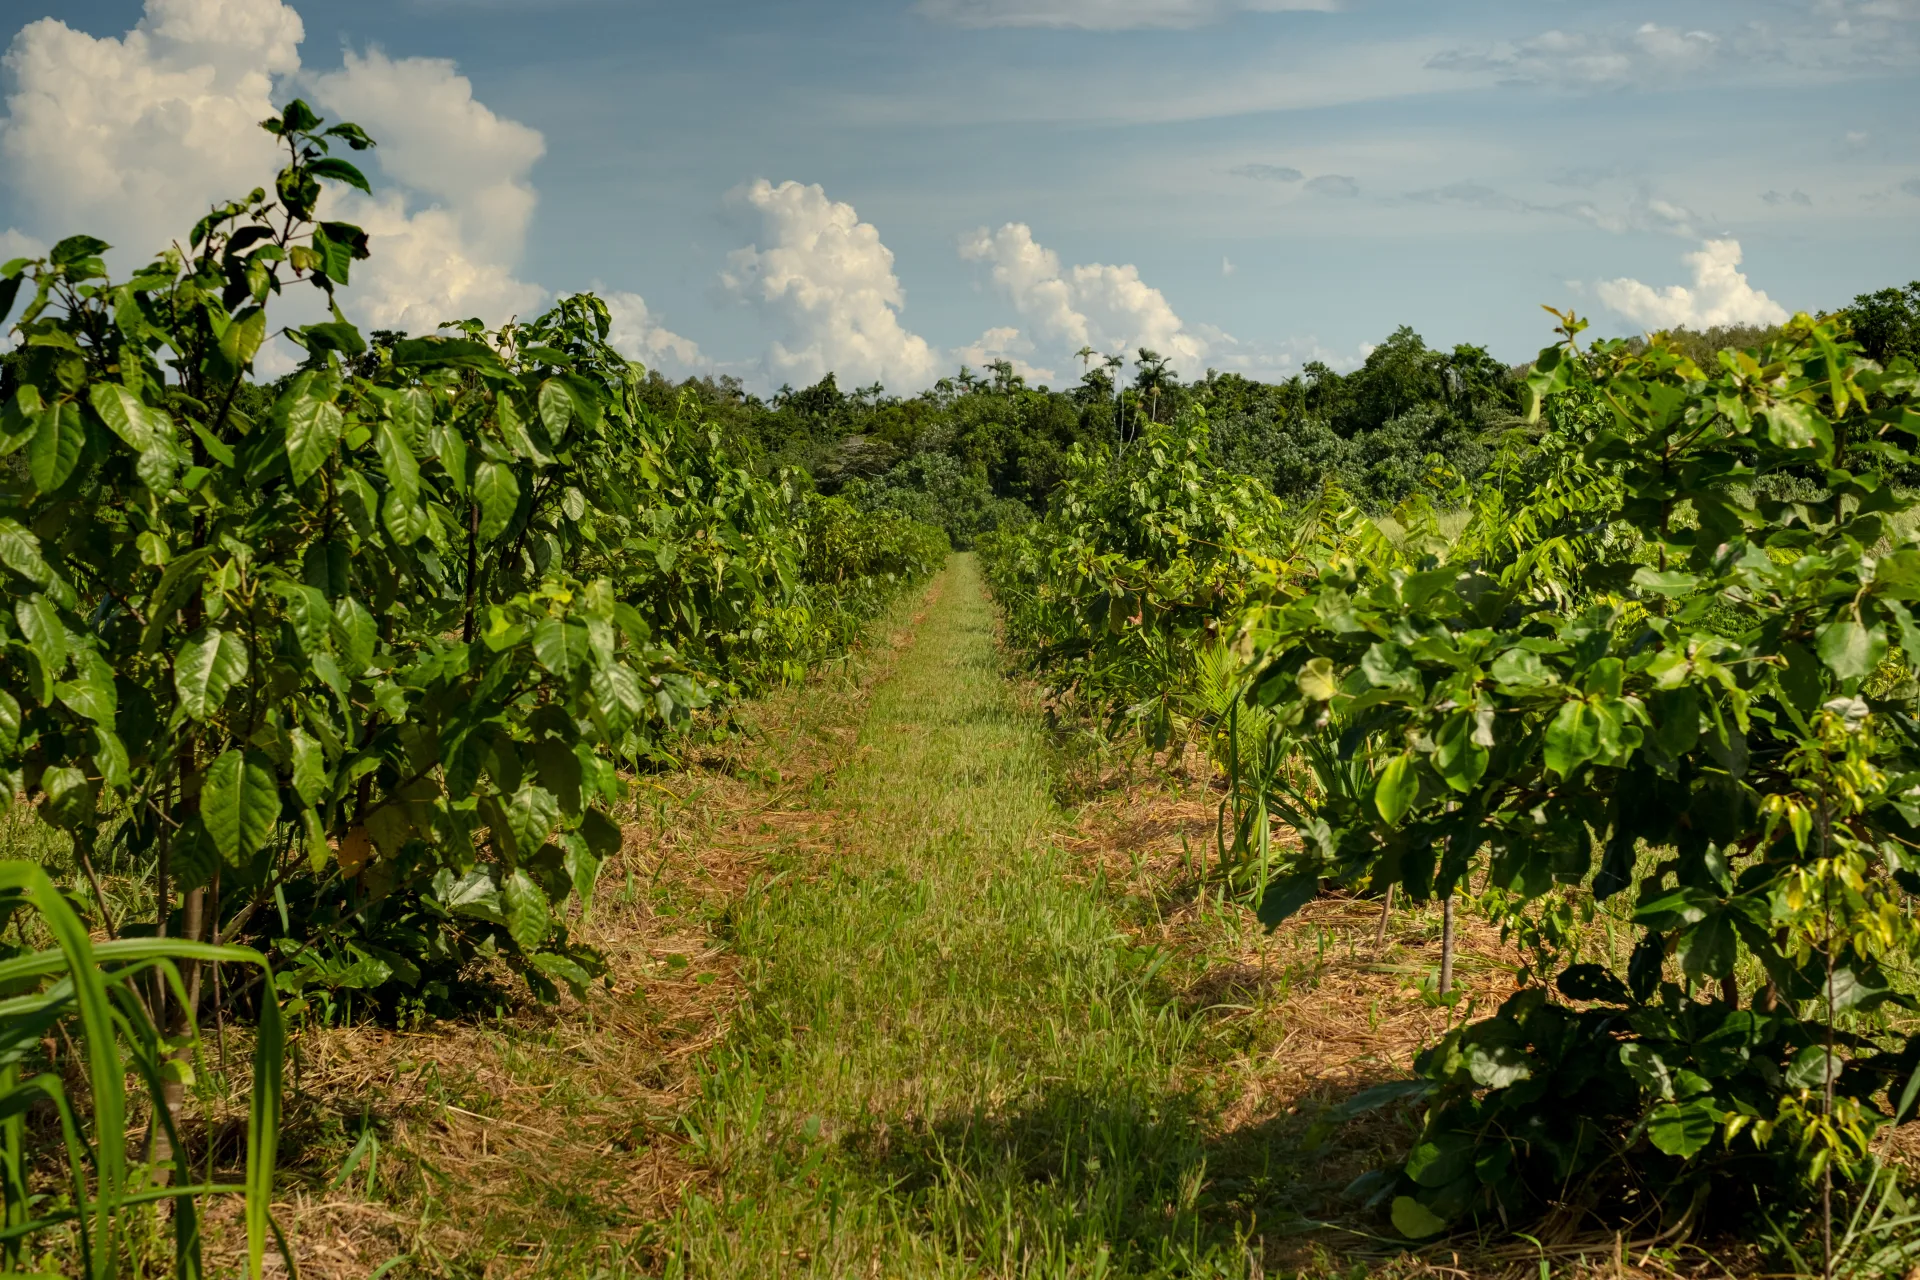
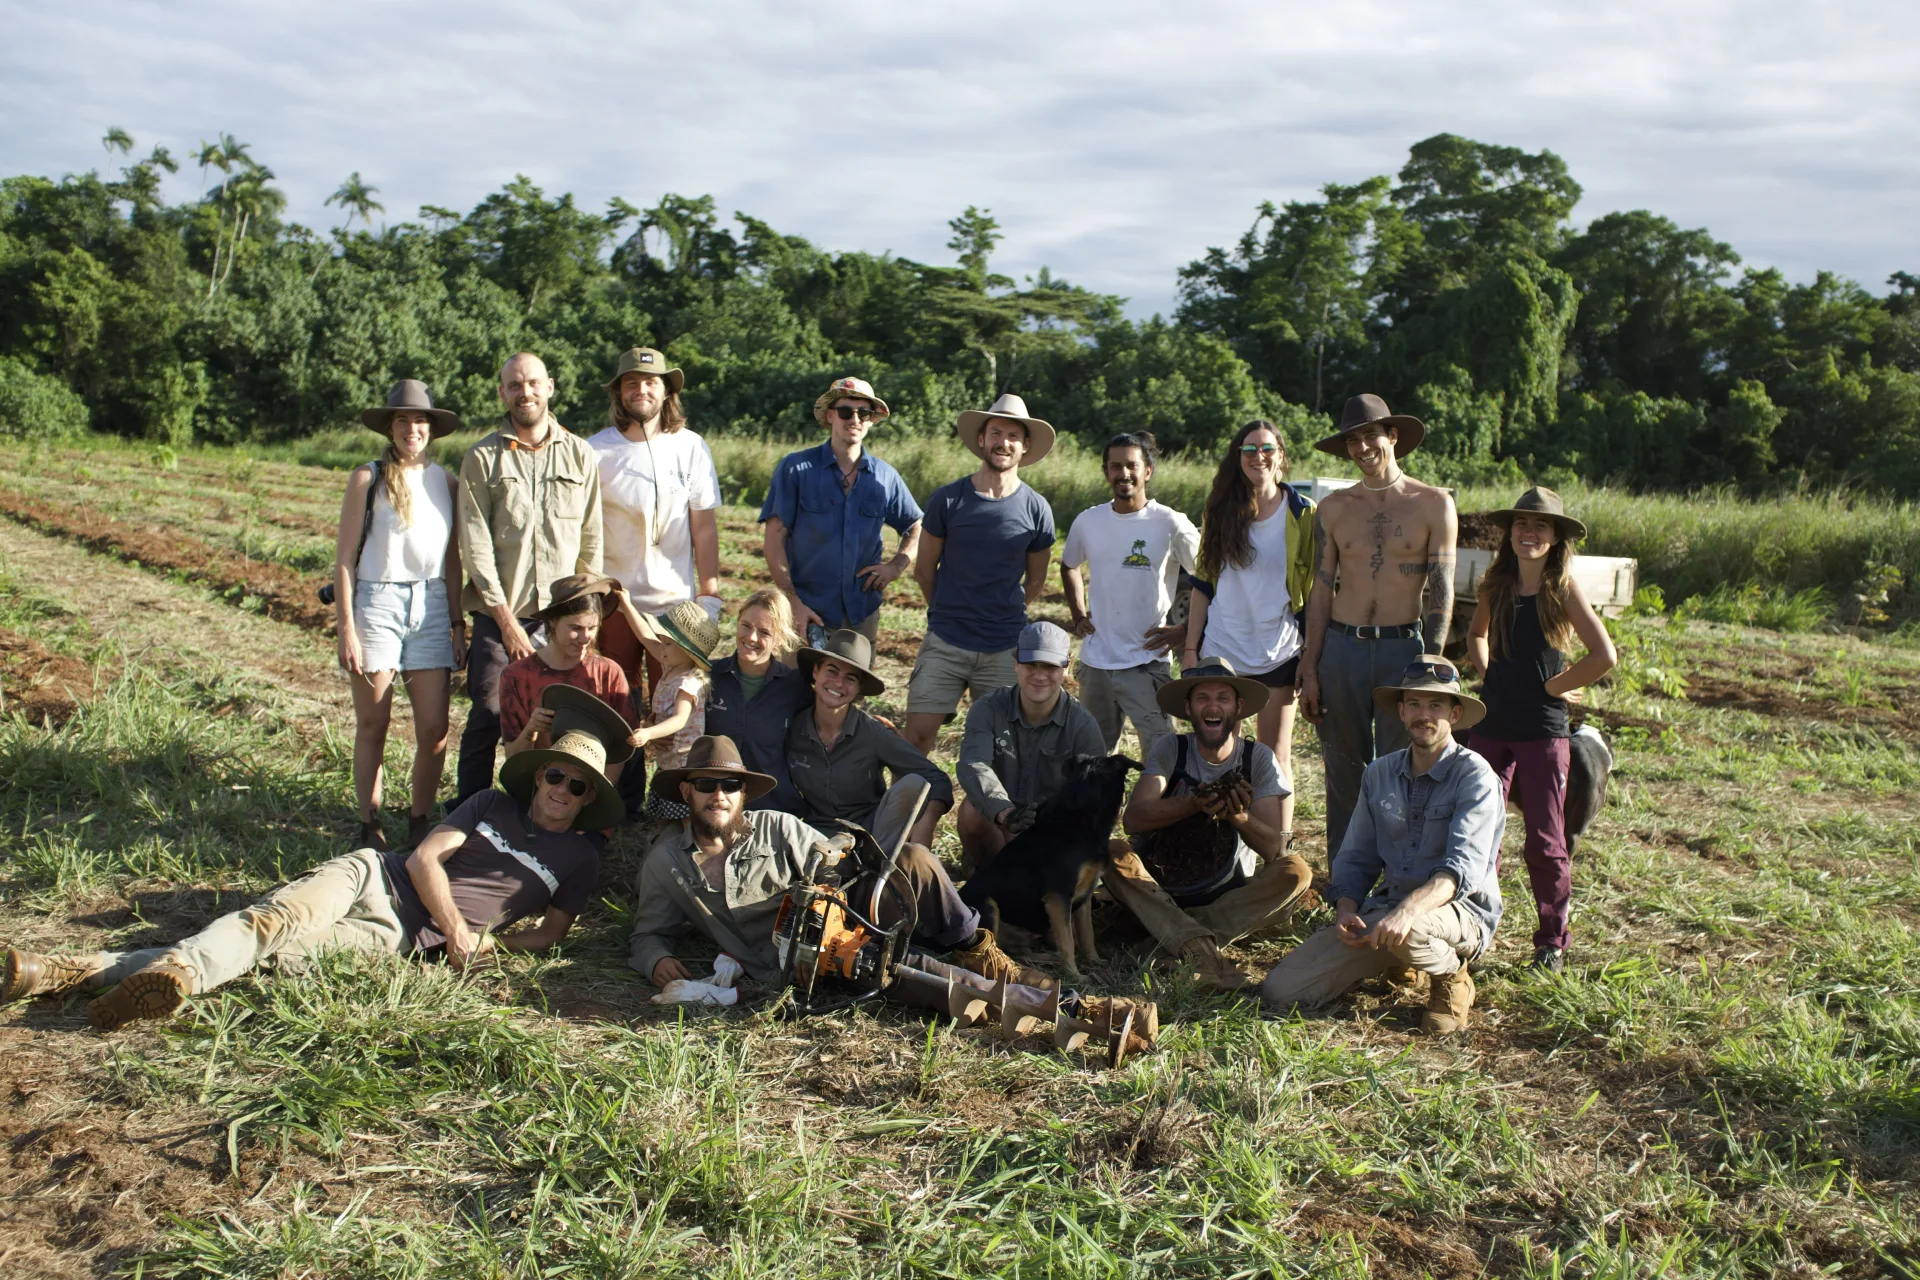
On country, by hand
Real numbers come from real walks.
Every figure on this site started as someone in a paddock — a farmer, a ranger, a researcher, a volunteer. Land-IP is the digital backbone of that work, never a substitute for it.

Built by The ClimateForce
What we learn at Cape Kimberley
is designed to travel.
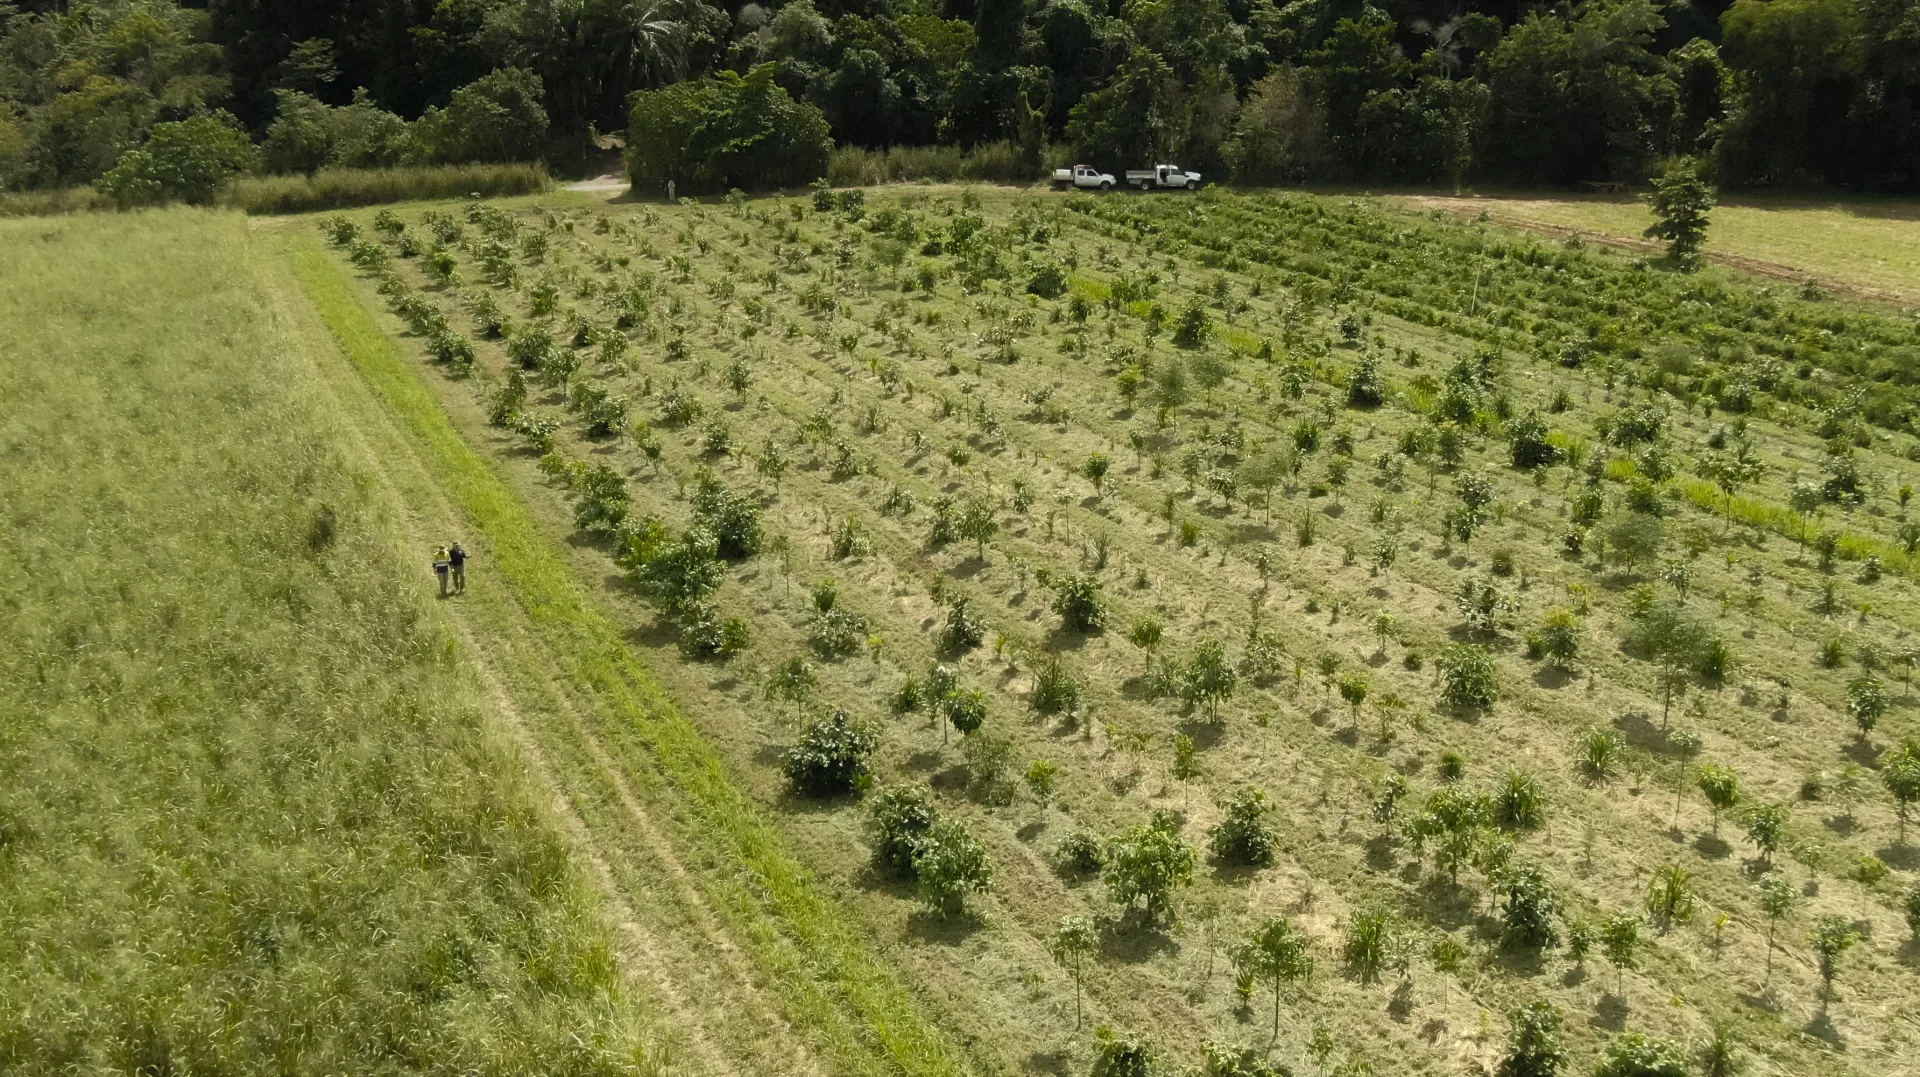
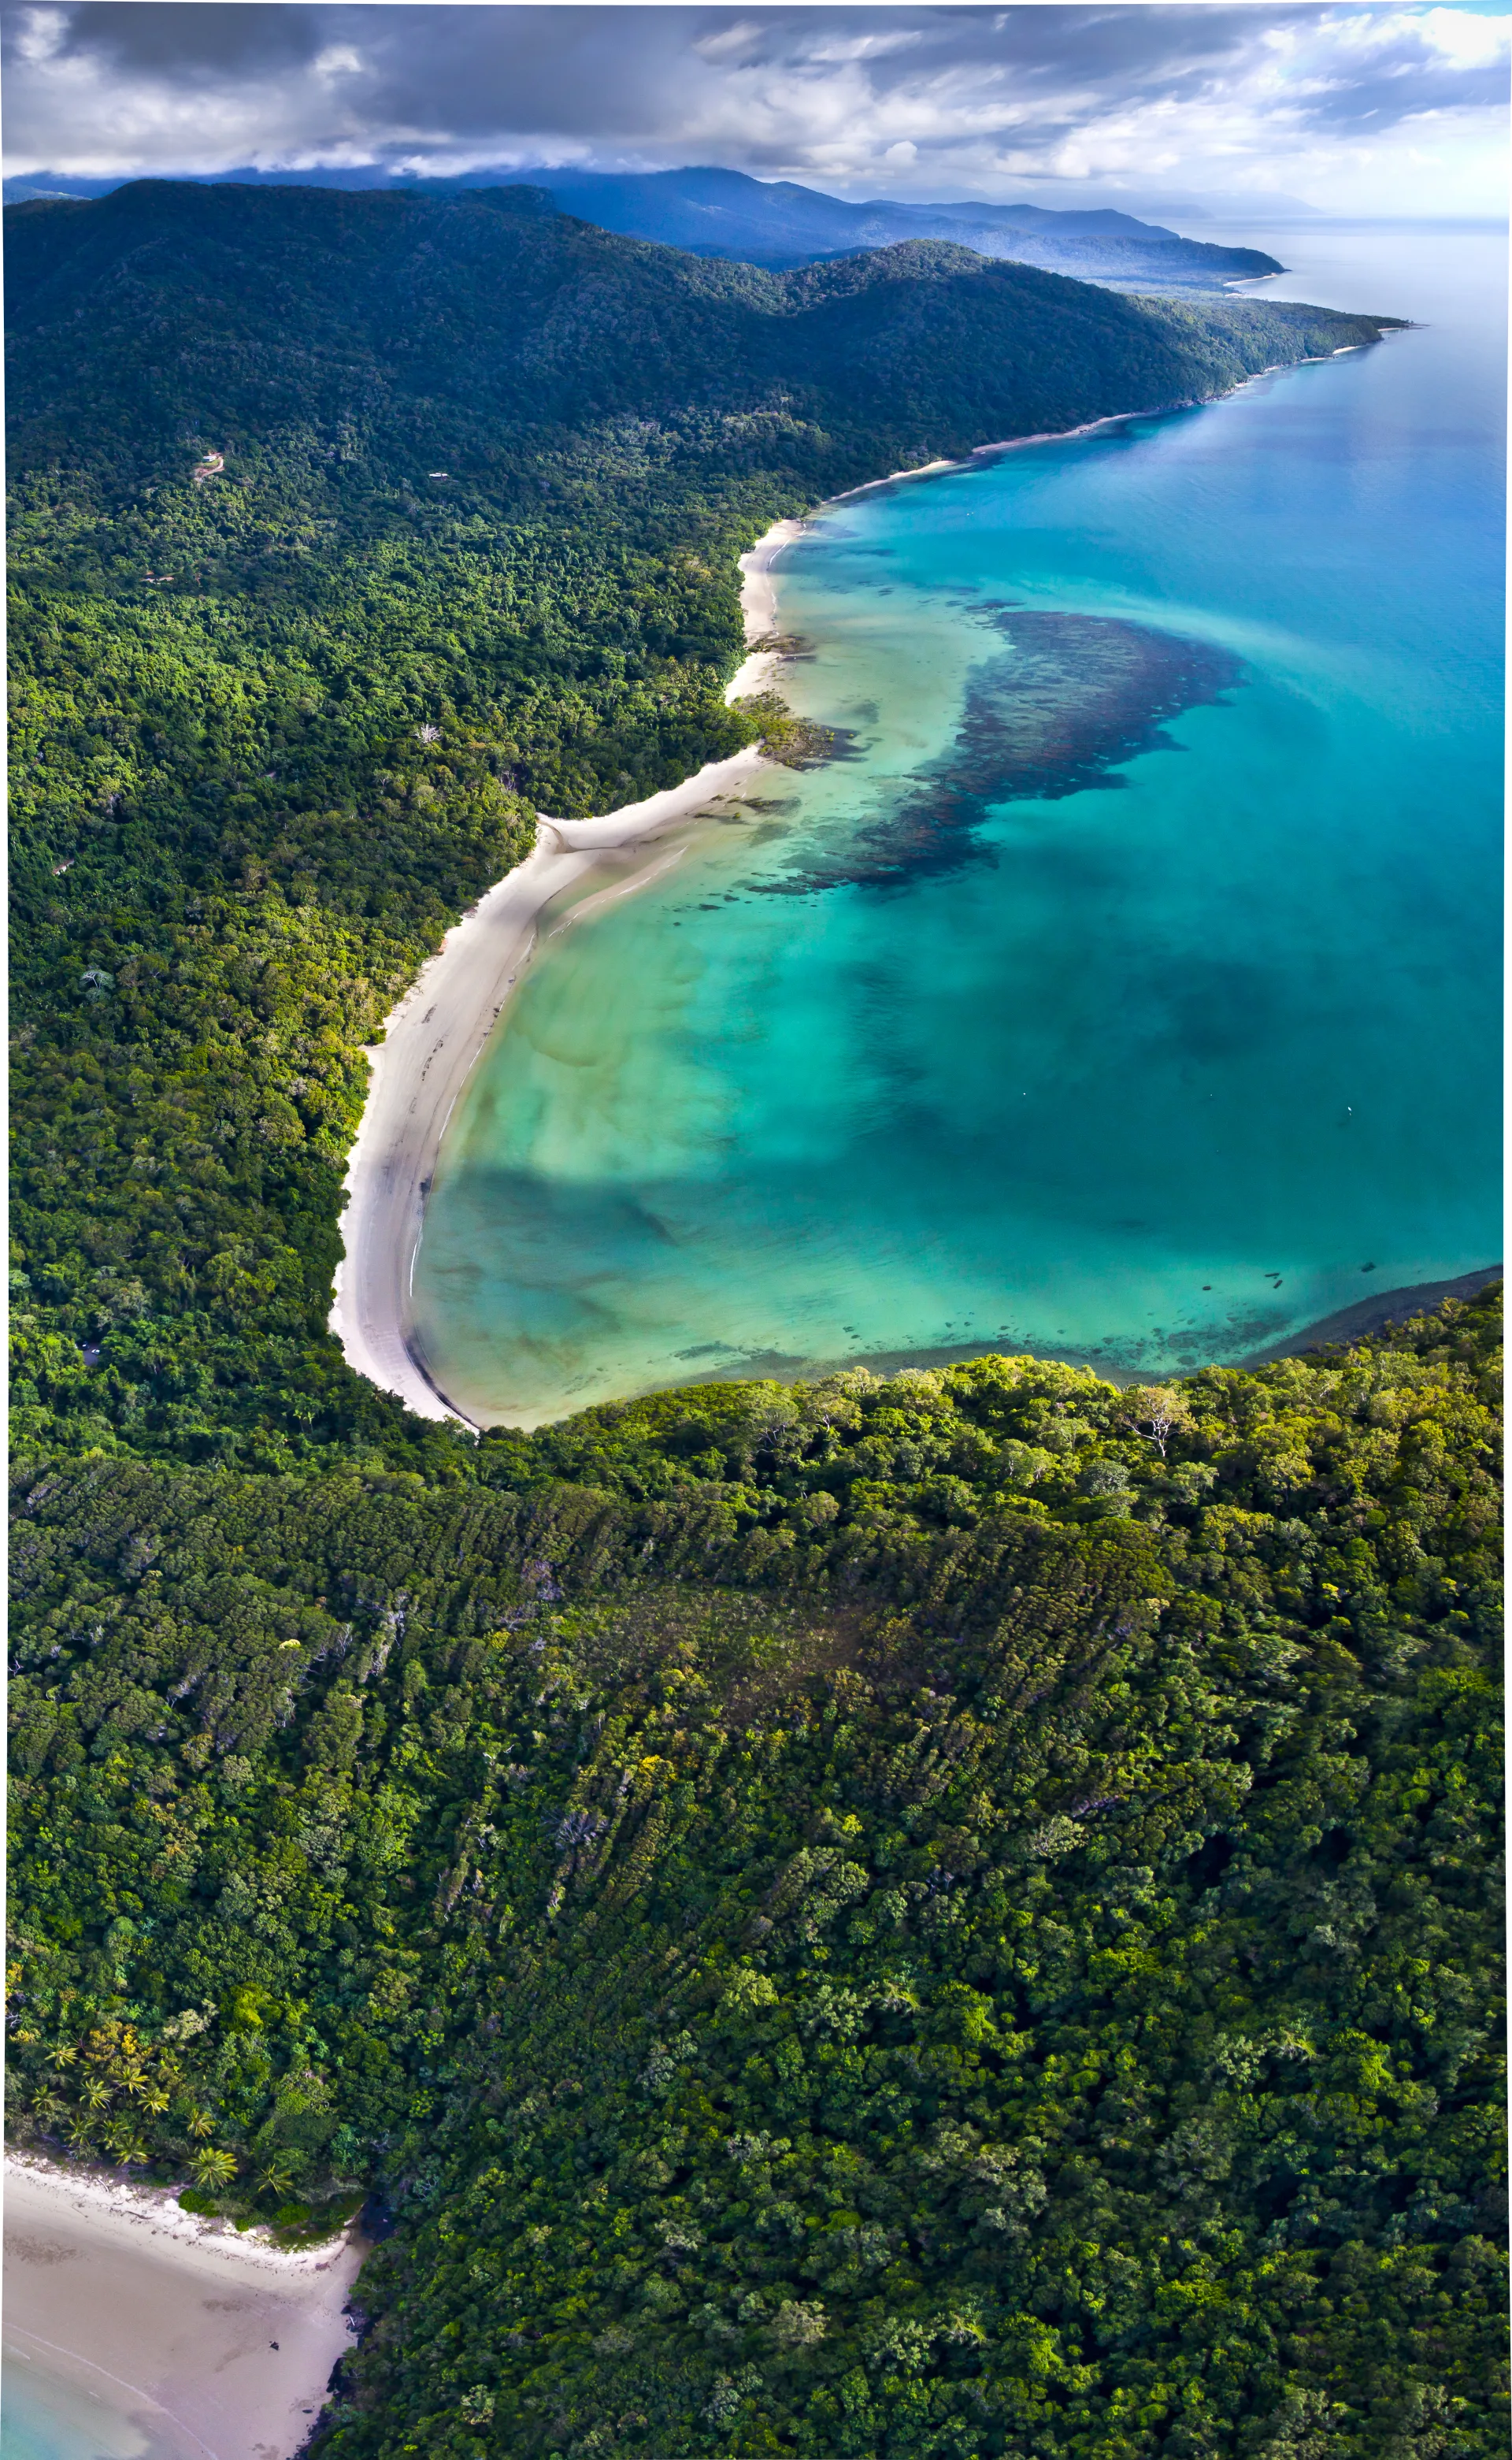
Land-IP is the work of The ClimateForce — a research effort centred at Cape Kimberley in the Daintree, where we trial regenerative systems on our own property before we ever recommend them onto anyone else’s. The platform is the digital backbone of that work, and the way it travels.
The thinking is open to whatever the world brings next. Today the systems we run are silvopasture, agroforestry, cropping, and native regeneration. The land conditions are tropical North Queensland. Tomorrow the systems are different — frankincense in Somalia, livestock and timber in temperate forests, crops we haven’t named yet. The thinking that produces them is the constant.
That’s why every number opens. The formula is visible. The constants are cited. The confidence is graded with the same framework the IPCC uses. The audit trail is cryptographic. Land-IP is built so a stranger can verify it without taking anyone’s word for it — including ours.
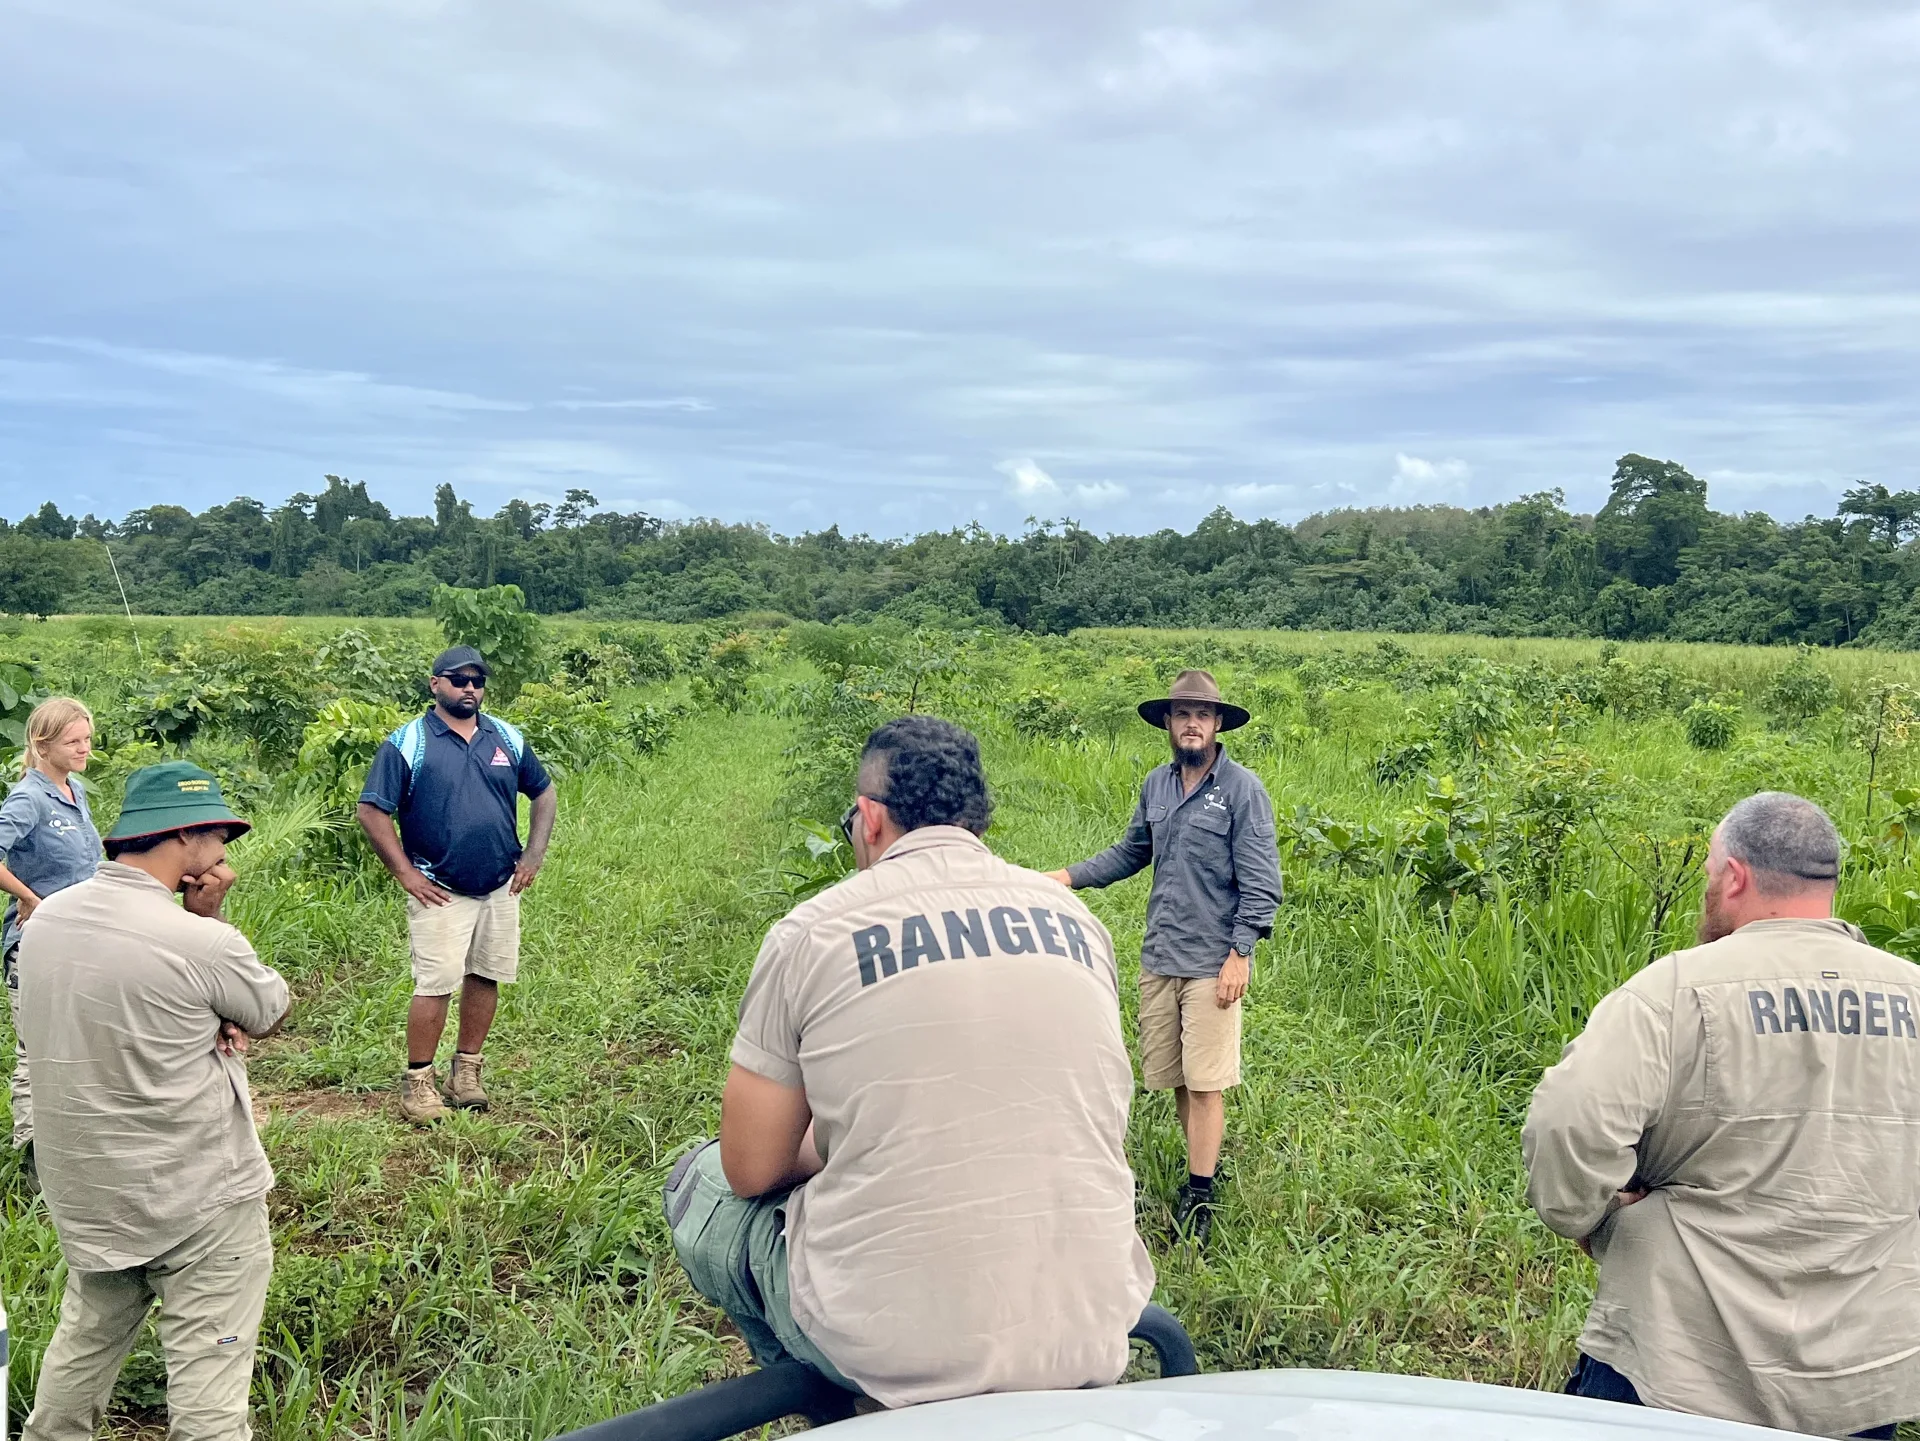
Partners on country
Land-IP is built alongside Jabalbina — Traditional Custodians of country in the Daintree — and in conversation with research, government, and farming partners across the Douglas Shire. These are working relationships, not advisory ones: domain expertise, local science, ground-truth calibration, cultural co-stewardship. Land-IP is the supporting layer; the work belongs to the people on the land.
Free to use
Try it now. Or talk to us.
Land-IP is free to use. We earn through the market activations that flow through the system. Design your land in a few minutes — no login. Or talk to us if you’re working on land we should hear about.
Design your land
Find your land, set the mix across the four systems, see what could activate against it. Yield, asset, and twenty-year carbon picture in your inbox. Physical units, ±50% sensitivity bands, no account.
Working on land — yours, your community’s, your country’s — and curious whether Land-IP could help record what it’s doing? Get in touch. We’re a small team and we read every message.
Become a partnerAcknowledgement of Country
The ClimateForce acknowledges the Eastern Kuku Yalanji peoples as the Traditional Custodians of the Land and Sea country on which we operate. We honour the meeting places, the sacred sites, and acknowledge that sovereignty of the land was never ceded. May we plant and grow new seeds together to repair the land and sea on which we rely.