
The Intelligent Source of Truth
for Land Potential
Eliminate the feasibility gap. Accelerate decisions with the only platform that integrates biological, infrastructure, and livelihood intelligence.
Same framework, every layer—
no gaps, no barriers
Feature-by-feature analysis reveals hidden capacity
Coordinated management multiplies individual gains
Aggregated intelligence enables strategic investment

One framework. Every scope.
The same measurement system works at paddock, property, district, and regional scale. No translation layers. No data silos.
Integration is where value compounds.
Speed for the Hunter.
Clarity for the Steward.
Different users need different outcomes from the same land. Institutional investors need velocity—the ability to screen and reject deals instantly. Landowners need resilience—the insight to protect and optimize their legacy.
One platform serves both. By grounding our data in operational reality, we provide the "Kill Switch" speed the market demands and the "Deep Insight" the steward requires.
The result: A single source of truth that aligns capital deployment with long-term land stewardship.
Unified intelligence: Speed for the transaction, resilience for the operation.
Deployment Velocity
For Investors: Automated constraint analysis allows you to screen 100 properties in minutes. Identify fatal flaws instantly.
Operational Resilience
For Stewards: See the hidden potential in your land. Turn constraints into assets and protect your legacy with deep insight.
Verified Truth
For Everyone: Move from estimated models to ground-truthed reality. Every data point is backed by 6 years of operational verification.
From individual asset to regional strategy
A single property generates insight. A district reveals patterns. A region enables strategic capital allocation. The same integrated framework powers every scale—no reconciliation required.
One platform.
Any market.
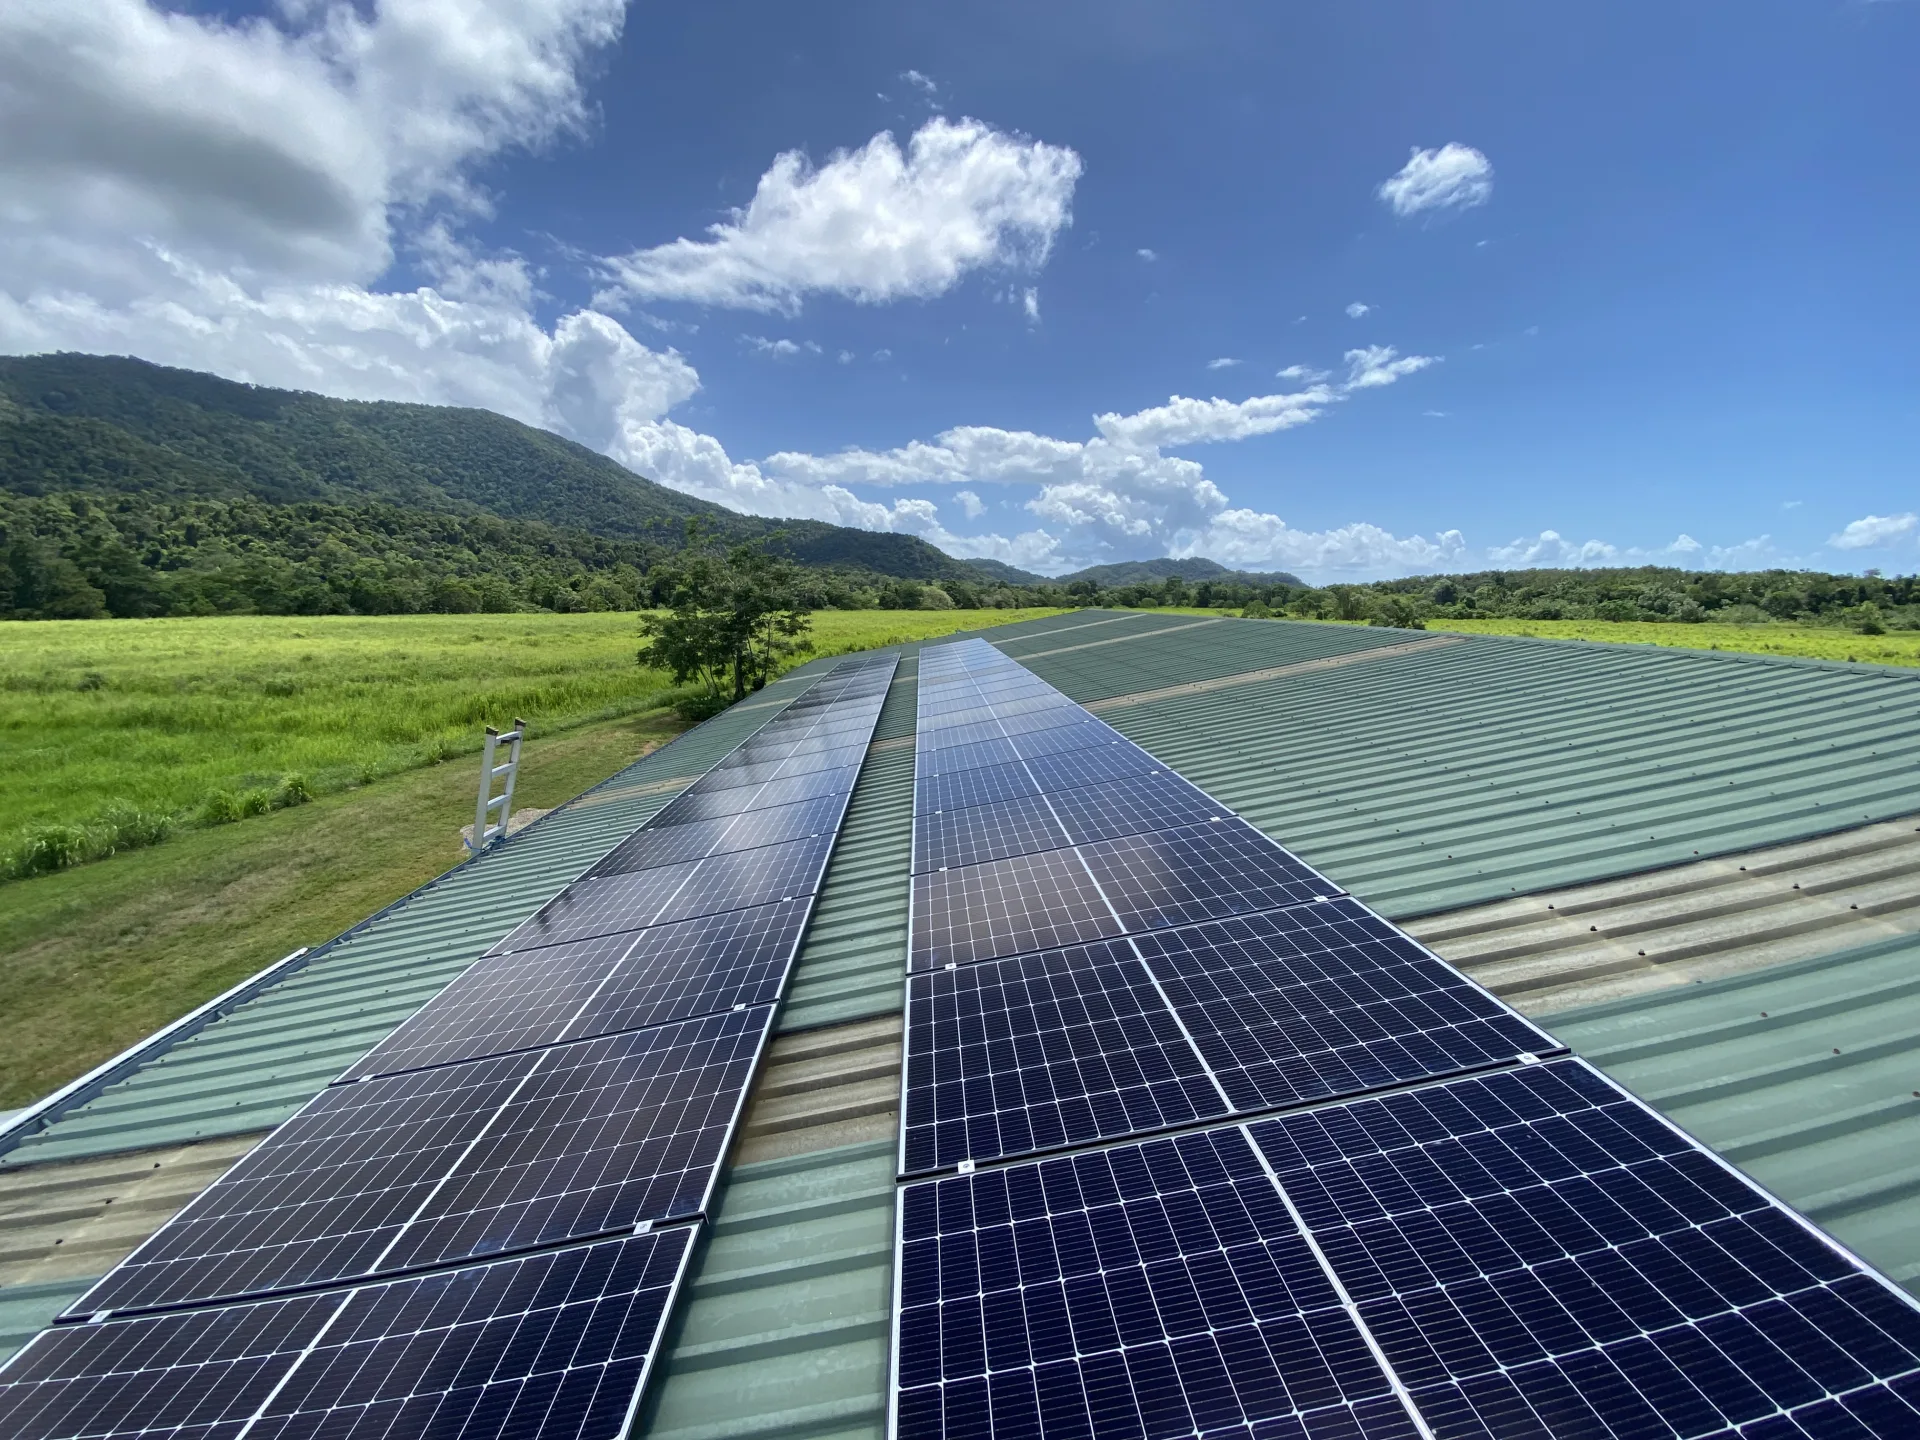
From energy to ecology
The same integrated measurement captures value across energy, insurance, agriculture, and natural capital—revealing how they support each other.
Whether you are placing a solar array, underwriting a policy, or verifying a carbon credit, the bottleneck is the same: Quality Data at Speed.
Land-IP eliminates the bottleneck. By standardizing the measurement of biological, infrastructure, and livelihood assets, we provide the universal baseline required for any high-value land transaction.
From energy prospecting to carbon verification, the same ground-truthed engine powers it all.
Energy
Identify grid capacity, slope constraints, and permit viability instantly.
Find viable sites 10x faster.
Insurance
Hyper-local flood, fire, and vegetation density modeling per parcel.
Price risk with granular accuracy.
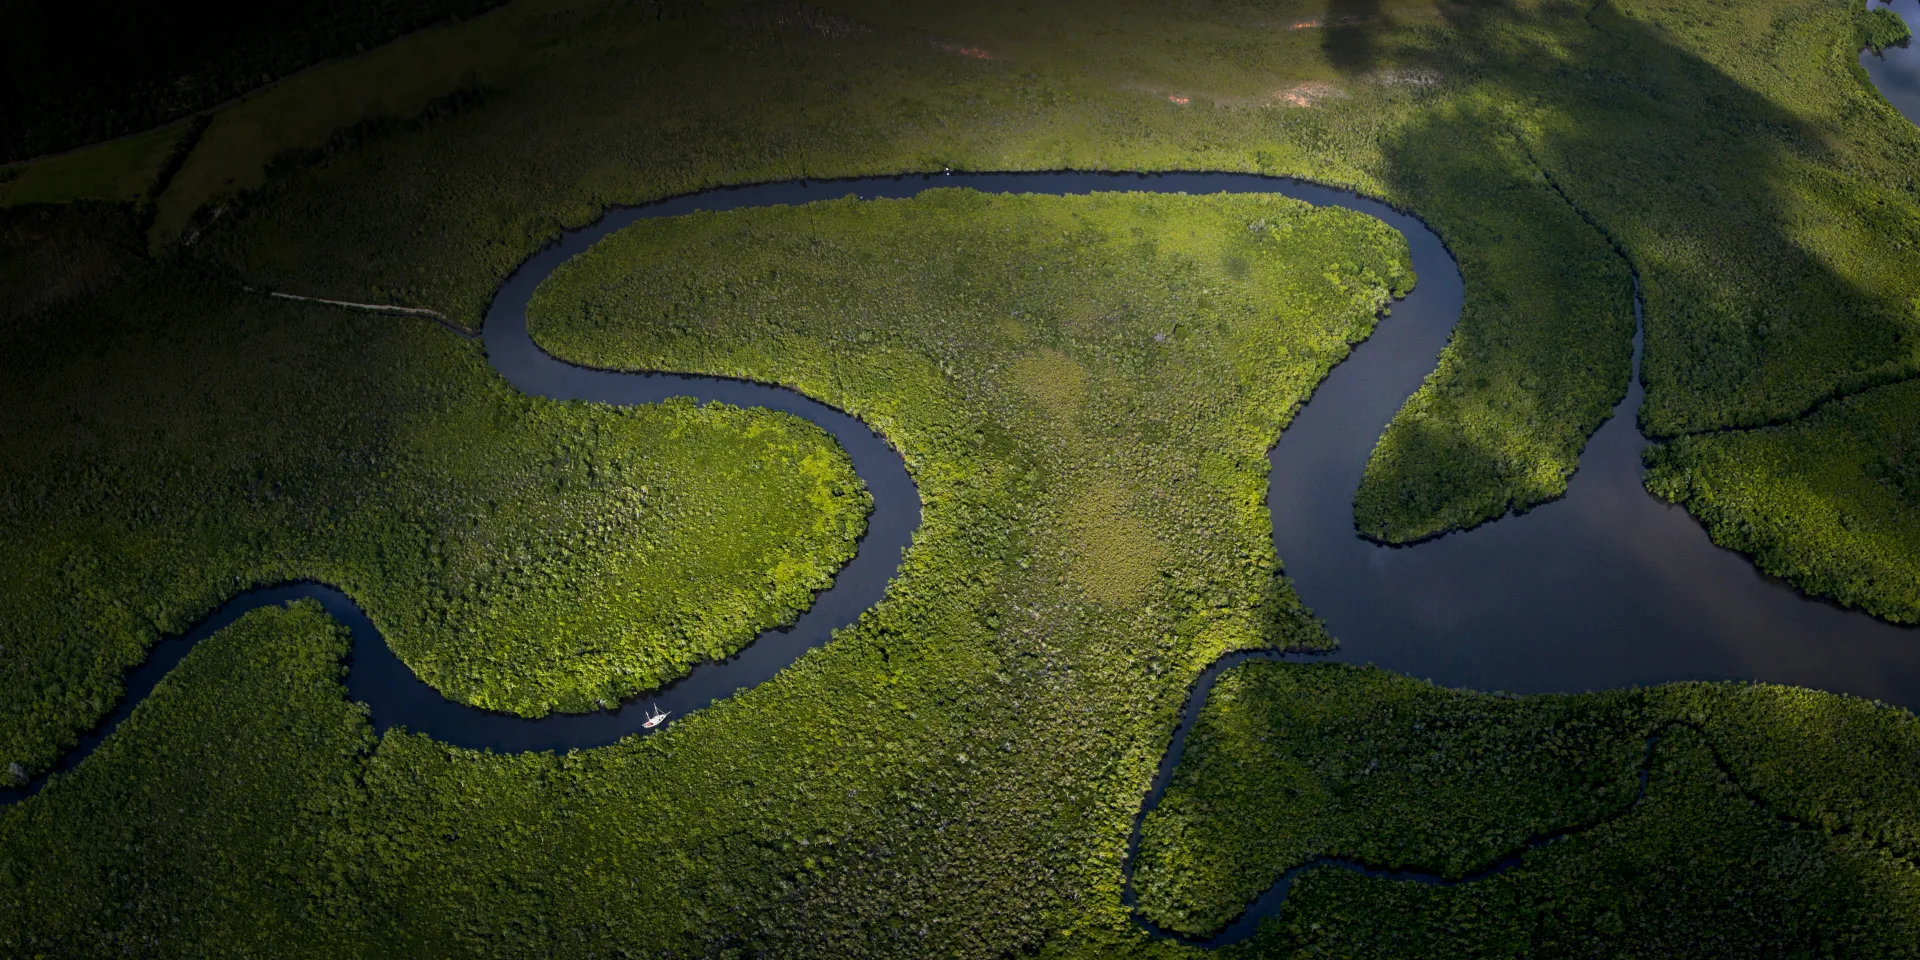
Natural Capital
Audit-grade history of land use and biodiversity outcomes.
Prove additionality and permanence.
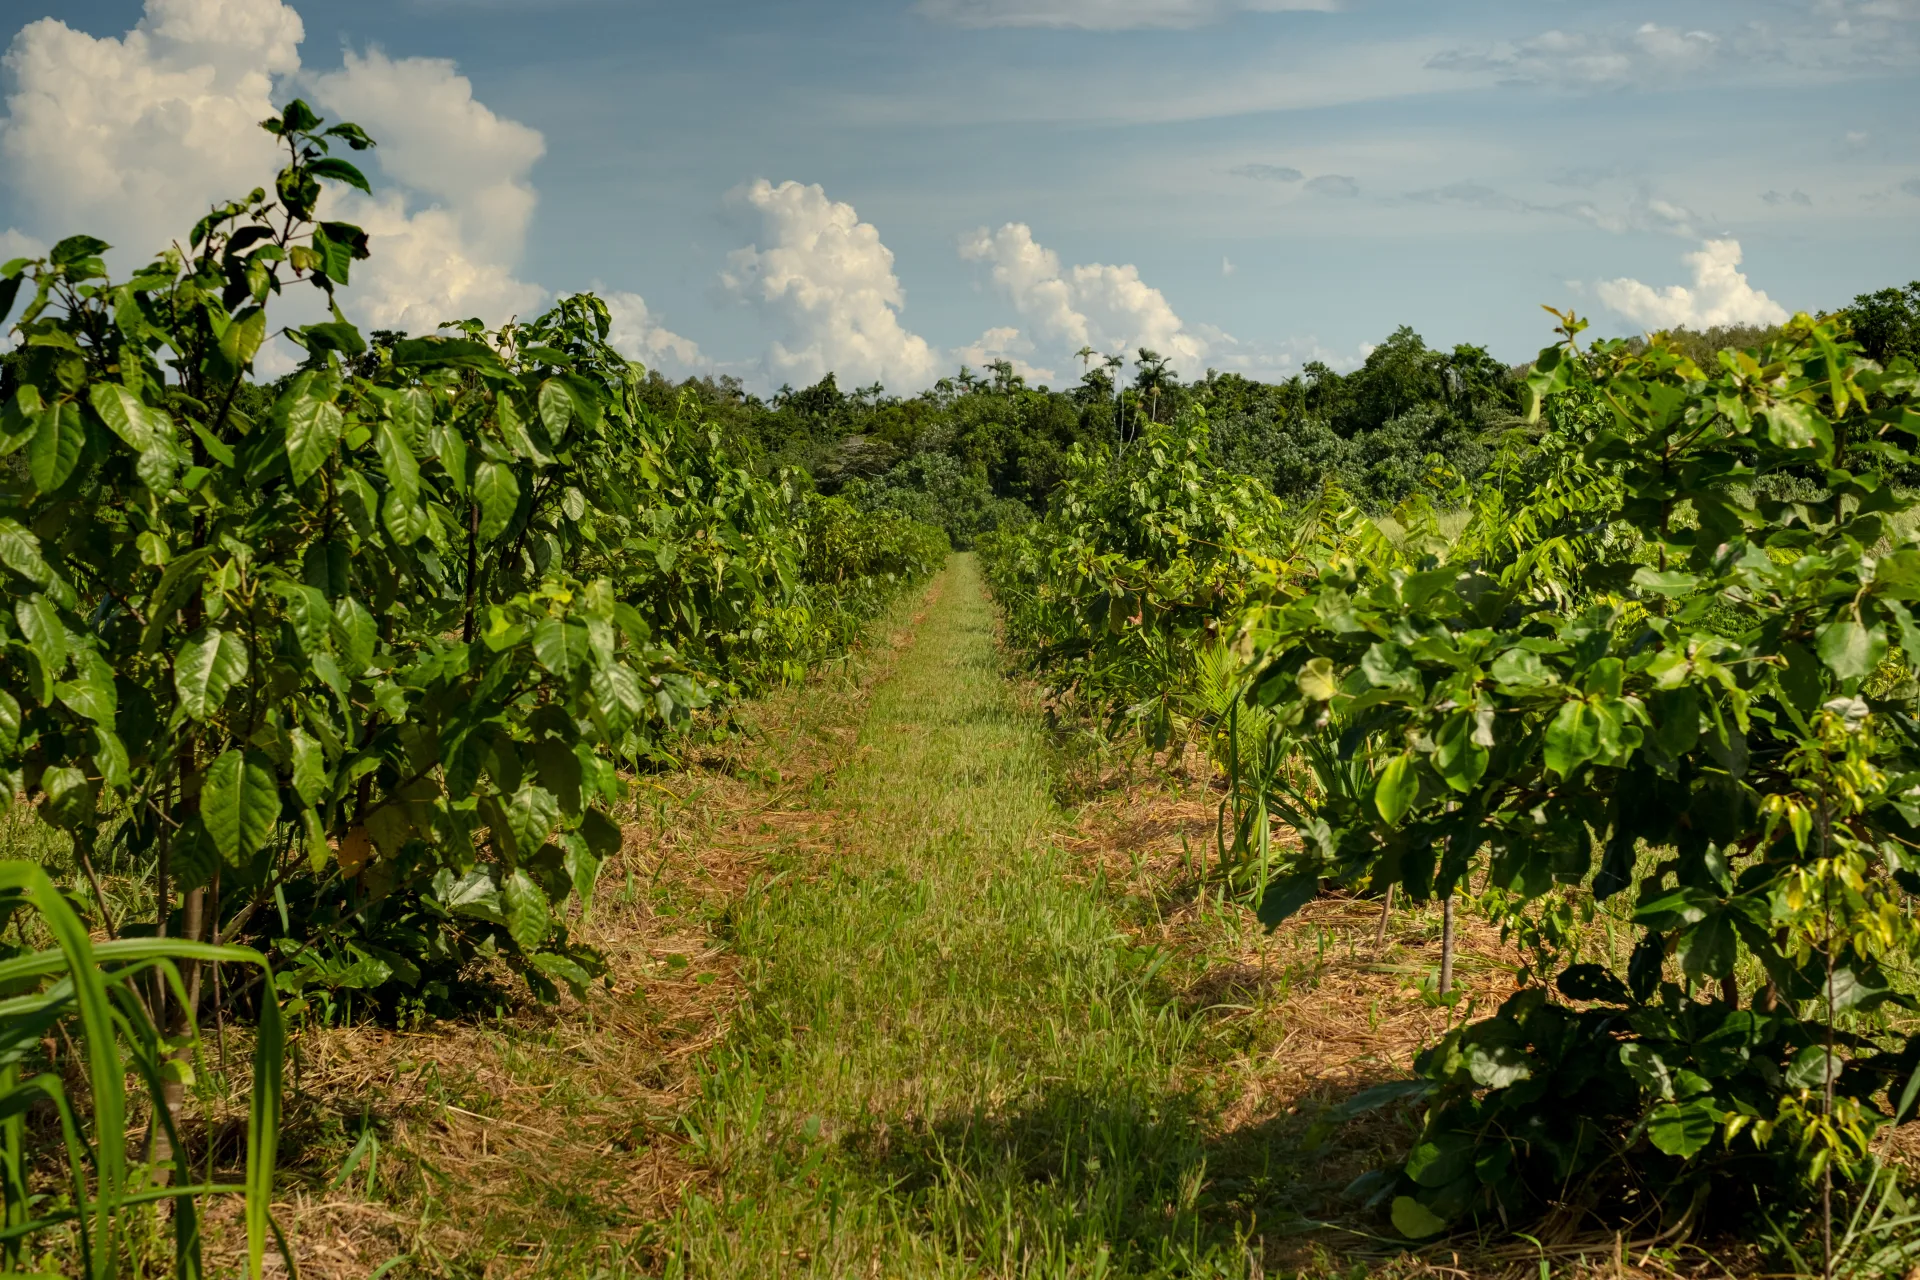
Agriculture
Optimize production while protecting long-term asset value.
Balance yield with resilience.


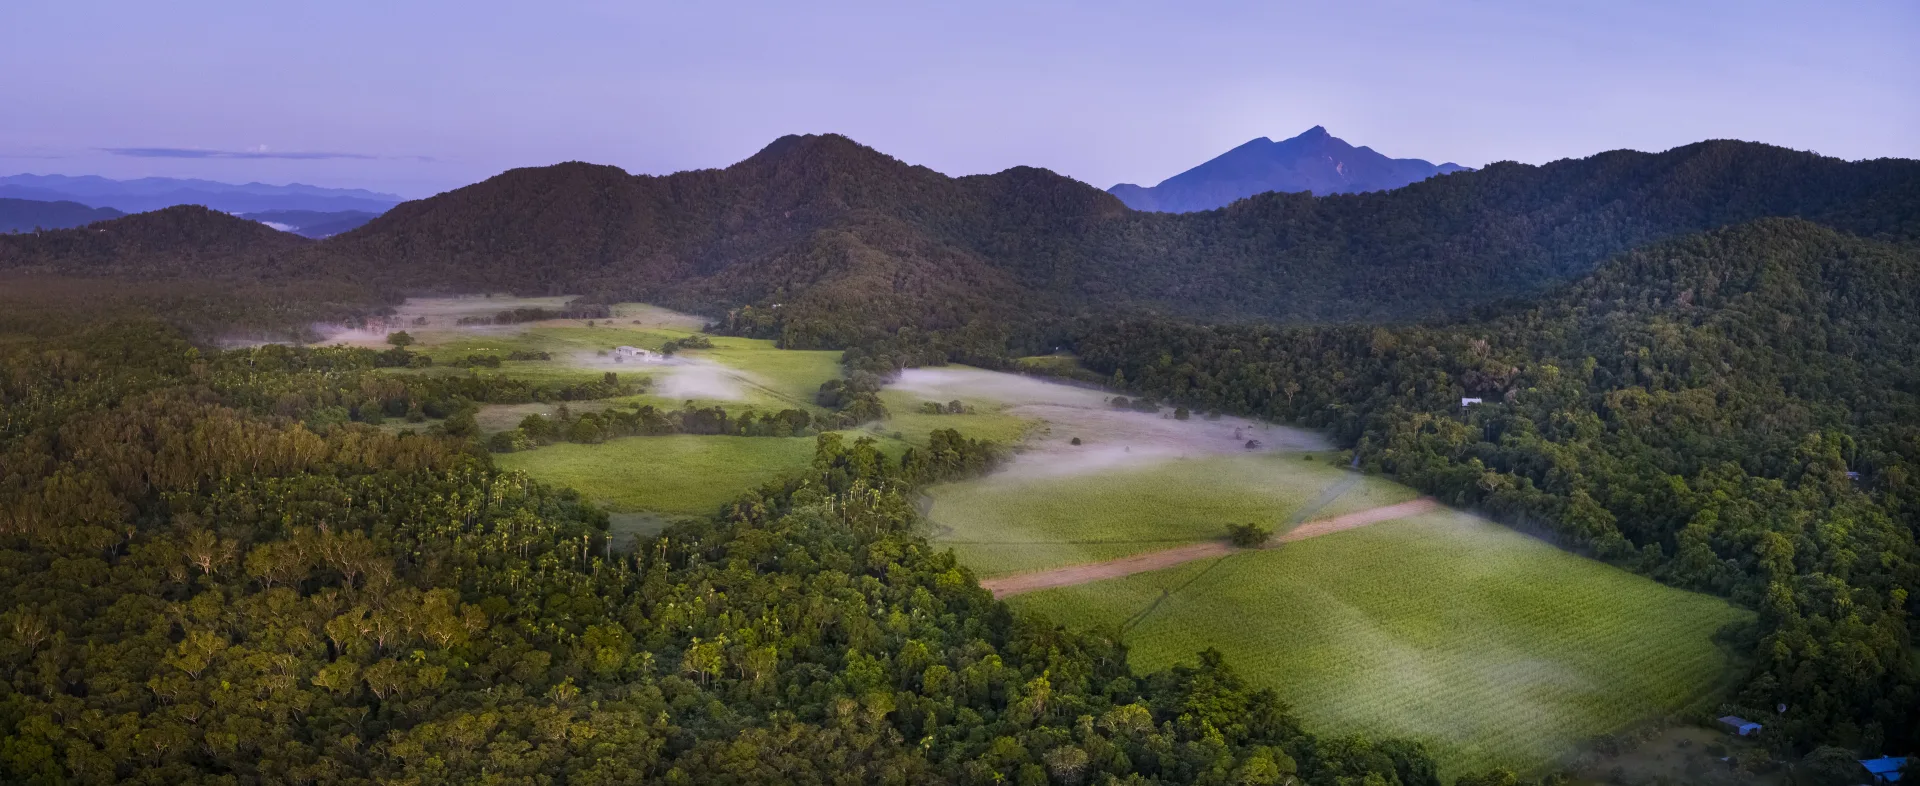
Cape Kimberley
Six years of integrated measurement. Conservation, agriculture, and community outcomes tracked together. See how the overlaps create compounding value.
From Data to Audit
How raw measurement becomes an asset you can bank on. We provide the consistent schema that capital markets require.

When data is consistent, assets become liquid
We provide the standardization that capital markets require. One schema. One standard. National readiness.
The Foundation
Every feature mapped. Every trait measured. No estimation.
The Network
See how assets perform against the district average. Identify outperformers.
The Market
Standardized data makes unique assets tradeable at scale.
The Standard
A unified schema for national-scale capital deployment.
See integrated value
for yourself
Explore Cape Kimberley's digital twin. Click any calculation. Follow the audit trail from feature to region. See what six years of integration creates.